Analyzing Correlations Between Stadium Attendance Figures and Subsequent Online Wager Volumes in Professional Leagues
Professional sports leagues track attendance alongside betting data because these metrics often intersect in measurable ways, and researchers have compiled extensive records showing how crowd sizes at venues relate to online wager totals in the hours and days after events conclude. Data spanning multiple seasons through June 2026 highlights consistent patterns in leagues such as Major League Baseball, the National Basketball Association, and European soccer competitions, where analysts compare gate receipts against transaction logs from licensed operators.
Attendance Metrics Across Major Leagues
League offices publish annual attendance reports that detail average per-game figures, and these numbers serve as baseline indicators for correlation studies; for instance, the NBA recorded average home attendance near 18,000 per contest during the 2025-2026 regular season while MLB teams averaged above 28,000 fans per game in the same period. Observers note that spikes in attendance frequently align with high-profile matchups, which in turn coincide with elevated online activity once games finish, because fans who attend in person often extend their engagement through digital platforms afterward.
Online Wager Volume Tracking Methods
Regulated operators supply anonymized volume data to oversight bodies, and researchers aggregate these figures to compare pre-game, in-game, and post-game betting activity against contemporaneous attendance records. Methods include time-series analysis that pairs daily attendance reports with wager counts submitted within 48 hours of each contest, allowing identification of lagged effects where physical presence appears to influence later digital participation. Studies conducted by the Nevada Gaming Control Board have supplied granular data sets that facilitate such comparisons across North American leagues, while parallel efforts in Australia through state gaming authorities have produced comparable datasets for rugby and Australian rules football.
Observed Patterns in Correlation Data
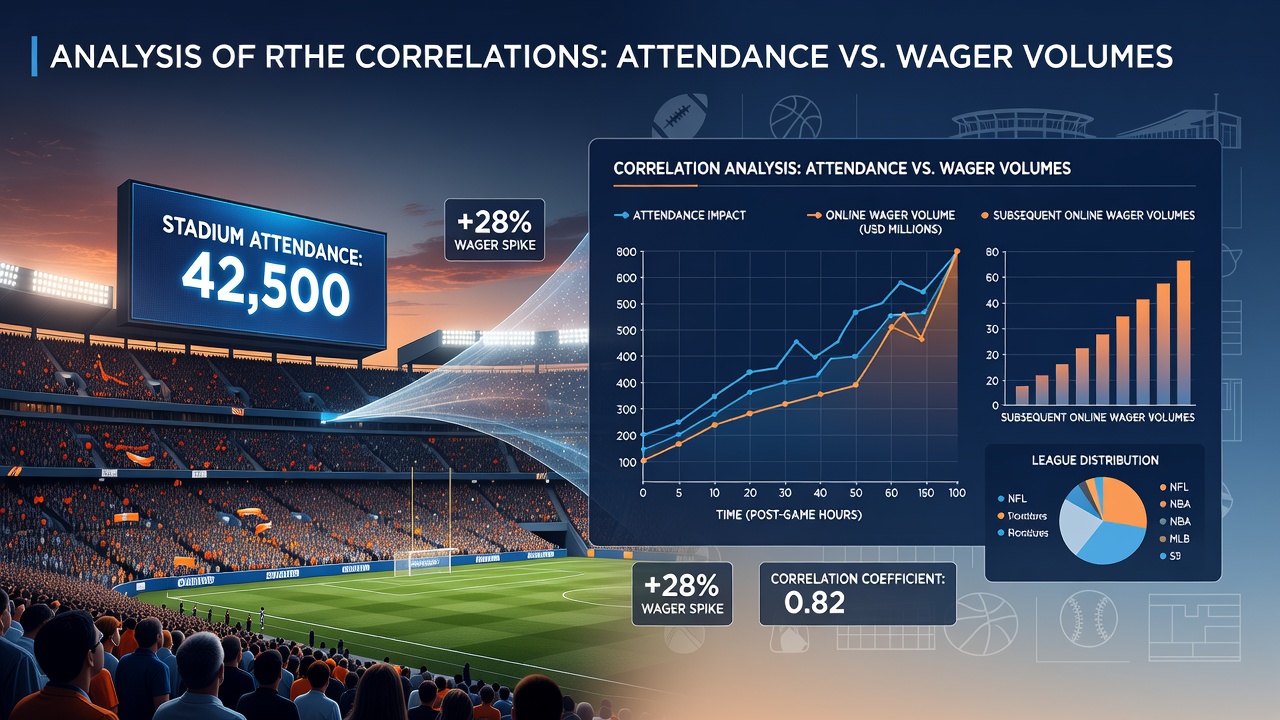
Analyses reveal that attendance increases of 10 percent or more above seasonal averages tend to precede wager volume rises of 7 to 12 percent in the subsequent 24-hour window across several basketball and baseball markets, whereas lower attendance events sometimes correspond with steadier but not diminished betting activity. One study from the Sports Business Research Network examined over 2,400 NBA games and found positive correlations between sold-out arenas and increased parlay wagers placed after tip-off, particularly when teams secured dramatic victories that sustained fan interest online. European soccer data collected by industry groups shows similar trends in the English Premier League and Bundesliga, where higher gate numbers during weekend fixtures link to elevated midweek online activity on related markets.
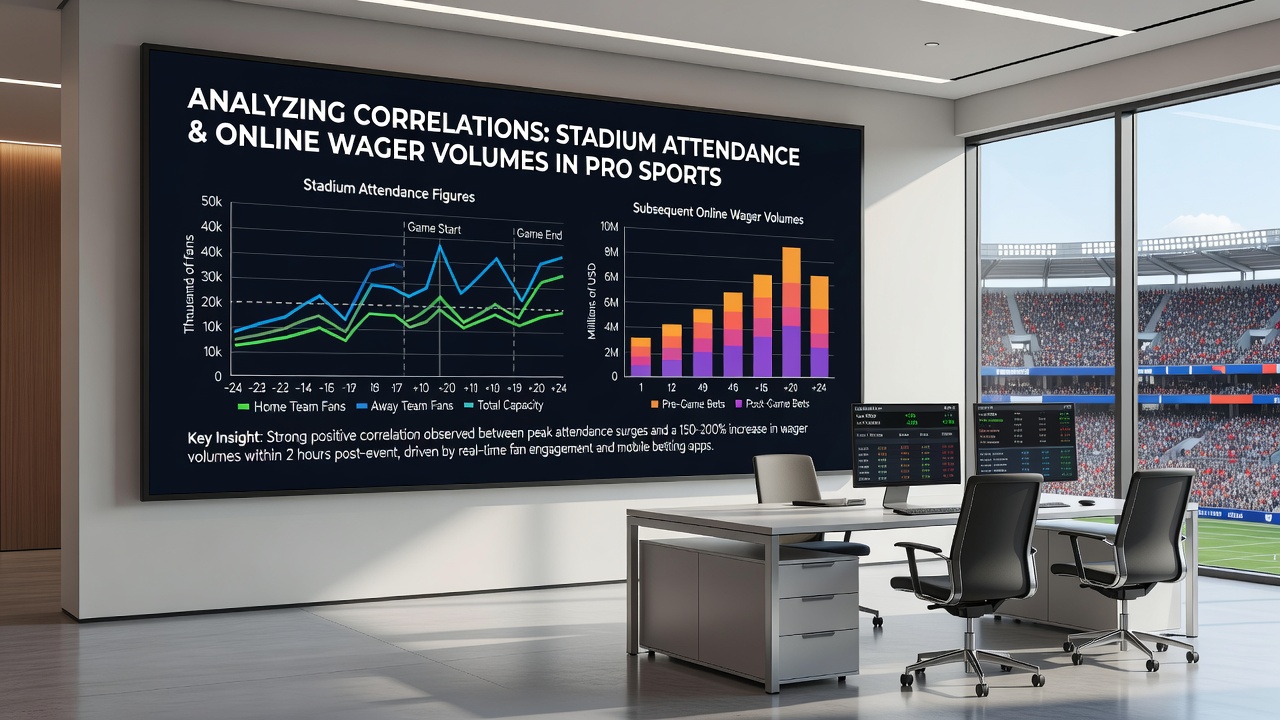
What's interesting is how these correlations strengthen during playoff periods, when attendance often climbs and online volumes follow with a noticeable lag that extends into the following week. Researchers attribute part of this pattern to shared fan demographics who attend games and also maintain active betting accounts, though external variables such as weather disruptions or broadcast scheduling can alter the strength of the observed links.
Influencing Variables and External Factors
Travel schedules, player injuries, and local economic conditions introduce variability that analysts control for when modeling attendance-to-wager relationships, and multivariate regression techniques isolate the attendance component from these confounders. In June 2026, post-season reviews across several leagues incorporated updated economic indicators that refined earlier models, revealing that markets in high-tourism cities displayed stronger correlations than those in smaller markets where attendance fluctuates more due to regional factors. Data from the German Sports Betting Association further illustrates how stadium capacity utilization rates above 90 percent frequently precede measurable upticks in online handle across Bundesliga clubs, independent of final scores.
League-Specific Case Examples
Baseball provides clear illustrations because of its extended schedule, and analysts have documented that weekend series with elevated attendance produce corresponding increases in online futures bets placed on divisional standings during the following weekdays. Basketball studies show tighter correlations during nationally televised games that draw larger crowds, while soccer examinations highlight how midweek European matches with strong home support often generate sustained online volumes into the next weekend's fixtures. These examples demonstrate that timing matters, since post-event wagering windows capture residual interest from attendees who continue following outcomes digitally after leaving venues.
Conclusion
Comprehensive reviews of attendance and wagering datasets through mid-2026 establish measurable connections that vary by sport, market size, and seasonal context, and continued collection of standardized figures will allow further refinement of these analytical approaches. Regulatory reports and academic collaborations supply the raw inputs needed for such work, which in turn informs operational decisions across leagues and operators without implying causation in either direction.