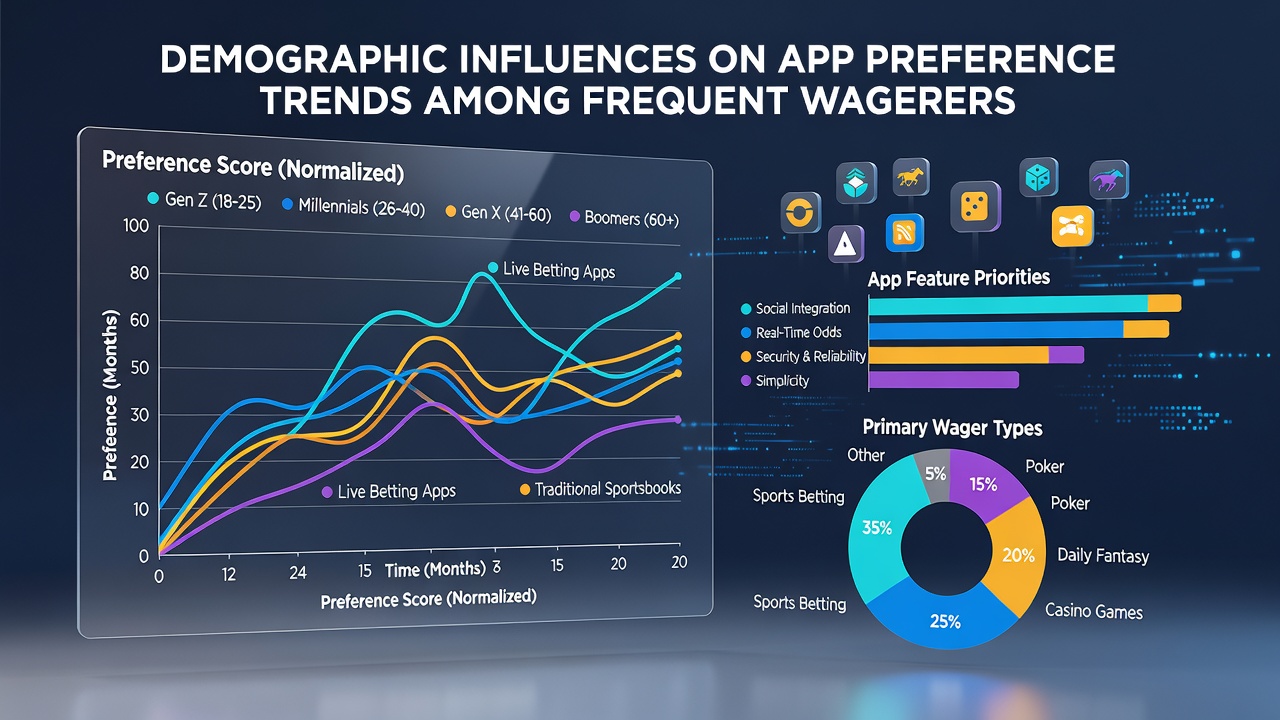
Demographic Influences on App Preference Trends Among Frequent Wagerers
Frequent wagerers select mobile apps based on a range of demographic factors that shape interface priorities, payment options, and market access, and studies continue to track these patterns across different population segments. Data from multiple regions shows that age, gender, income levels, and geographic location drive distinct choices in platform features, with younger users favoring rapid navigation tools while older groups prioritize detailed analytics and compliance indicators. As of June 2026, industry reports highlight steady growth in app downloads among frequent users aged 25 to 44, where preferences lean toward integrated live-streaming and instant deposit functions that align with higher mobile engagement rates.Age Groups and Feature Priorities
Younger frequent wagerers between 18 and 34 demonstrate strong selection for apps that support quick session starts and social sharing elements, according to aggregated usage data compiled by research teams at multiple universities. These users often connect multiple accounts and seek customizable notifications that deliver real-time updates without excessive setup steps. In contrast, those aged 45 and above show higher engagement with platforms offering robust verification layers and historical performance tracking, since these features support longer-term decision patterns observed in longitudinal tracking studies.
Researchers have noted that middle-aged segments frequently combine both live betting modules with scheduled event calendars, creating hybrid usage that bridges speed and depth. Evidence from North American surveys indicates this group maintains the most consistent retention rates across app updates, largely because developers incorporate feedback loops that refine older interface designs without disrupting established workflows.
Gender-Based Variations in Platform Selection
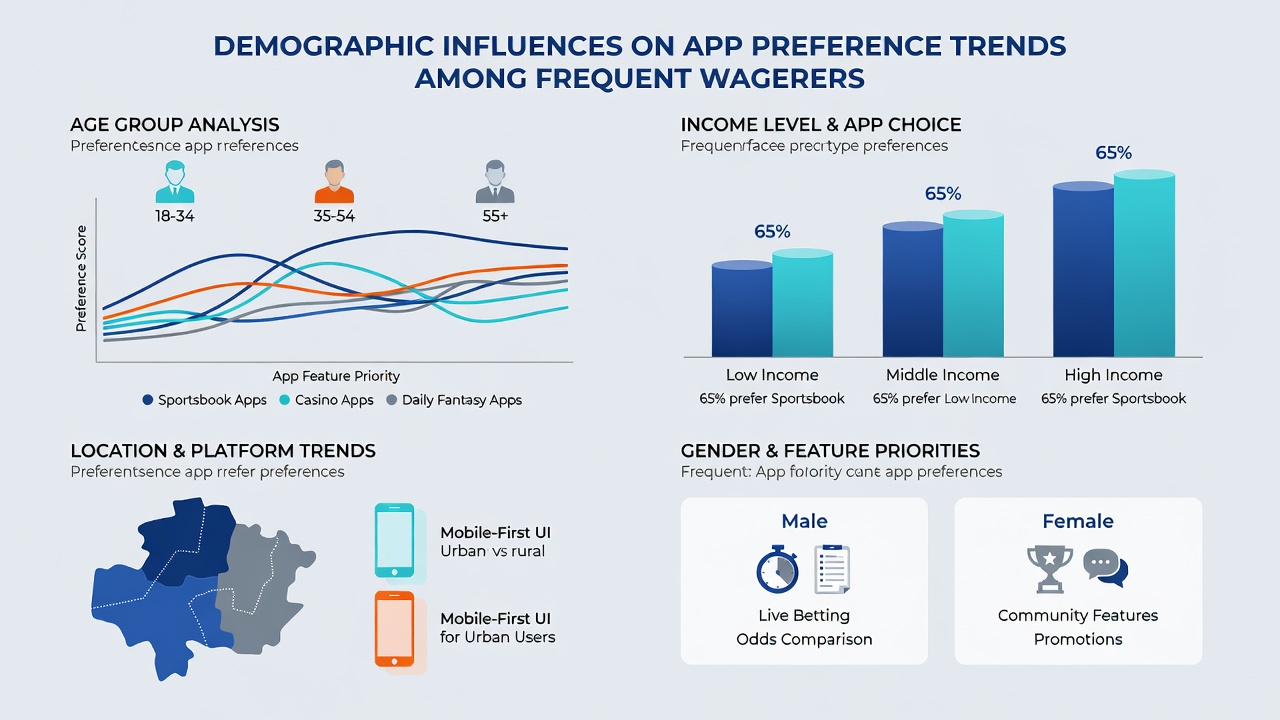
Gender influences extend to layout preferences and community tools, where data collected by the Canadian Centre on Substance Use and Addiction reveals women frequent wagerers allocate more time to apps with advanced filtering for niche markets and educational resources embedded directly in the dashboard. Men in the same datasets tend to select interfaces that emphasize volume-based promotions and multi-sport dashboards, patterns that hold across several tracked cohorts from 2024 through mid-2026.
These distinctions appear in download statistics and session duration metrics rather than absolute participation numbers. Observers note that targeted marketing campaigns from operators have adjusted content presentation accordingly, resulting in measurable shifts in user acquisition by demographic slice.
Income Levels and Regional Access Factors
Income brackets correlate strongly with payment integration choices, and higher-earning frequent wagerers show preference for apps supporting cryptocurrency options alongside traditional banking rails, figures that surface in transaction reports issued by regulatory bodies in Australia and parts of Europe. Lower to middle income segments instead gravitate toward apps with built-in budgeting displays and loyalty structures that convert activity into redeemable credits over extended periods.
Geographic location adds another layer, since users in densely populated urban centers access apps with broader international market coverage while those in rural areas select platforms optimized for regional leagues and lower data consumption modes. The Australian Institute of Family Studies has documented how these location-based differences influence not only app choice but also average wager sizes and frequency of in-play activity across comparable demographic profiles.
Education and Cultural Influences on App Design
Education levels intersect with content complexity preferences, as users holding advanced degrees often explore apps that provide statistical modeling tools and probability calculators within the same interface. Cultural background further shapes expectations around language support and community moderation standards, leading developers to release localized versions that maintain core functionality while adapting visual elements and support channels.
One study released in early 2026 tracked over 12,000 frequent users across three continents and found that bilingual interfaces increased session length by measurable margins among specific ethnic cohorts without altering overall retention curves. These findings encourage operators to refine localization strategies rather than rely on generic translation layers.
Conclusion
Demographic variables continue to steer app preference trends among frequent wagerers through measurable differences in feature adoption and usage duration. Patterns observed in 2026 data underscore teh importance of segmented development approaches that accommodate age, gender, income, and regional distinctions simultaneously. Continued monitoring by academic and regulatory sources will likely reveal further refinements as new payment technologies and interface standards emerge across global markets.