
Team Travel Fatigue Shapes Late-Game Wagering Markets Across Professional Leagues
Travel schedules create measurable effects on player performance that ripple through late-game betting lines in leagues such as the NBA, NFL, NHL and MLB, and analysts at major sportsbooks adjust totals and spreads accordingly when back-to-back road games pile up. Data from the 2025-2026 season shows teams logging more than 30,000 air miles by mid-June often post reduced fourth-quarter efficiency, a pattern that sharpens odds movement in the final minutes of contests.
Measuring the Physical Toll
Researchers track circadian disruption, sleep loss and muscle recovery through wearable devices and game logs, then feed those metrics into models that forecast scoring margins after the third quarter. Studies compiled by the Australian Institute of Sport link transcontinental flights longer than four hours with a 4-7 percent drop in field-goal percentage during the final 12 minutes, while shorter regional hops produce smaller but still detectable declines. These figures enter algorithms used by oddsmakers who shade live totals downward when the visiting club arrives the same morning as tip-off.
League-Specific Patterns Emerge
NBA schedules generate the clearest signals because of frequent cross-country trips; teams playing on the second night of a back-to-back road set have covered the spread in only 41 percent of games since 2022 according to internal league tracking. The NHL shows similar trends during extended western swings, where altitude changes compound fatigue and push overtime totals lower in data sets reviewed by betting desks. MLB analysts note that starting pitchers crossing multiple time zones post elevated ERA after the sixth inning, prompting live bettors to target under props once bullpens enter. The NFL compresses travel into fewer dates yet still records measurable fourth-quarter rushing declines on Monday-night road games following West Coast matchups.
Analytics Teams Feed Market Adjustments
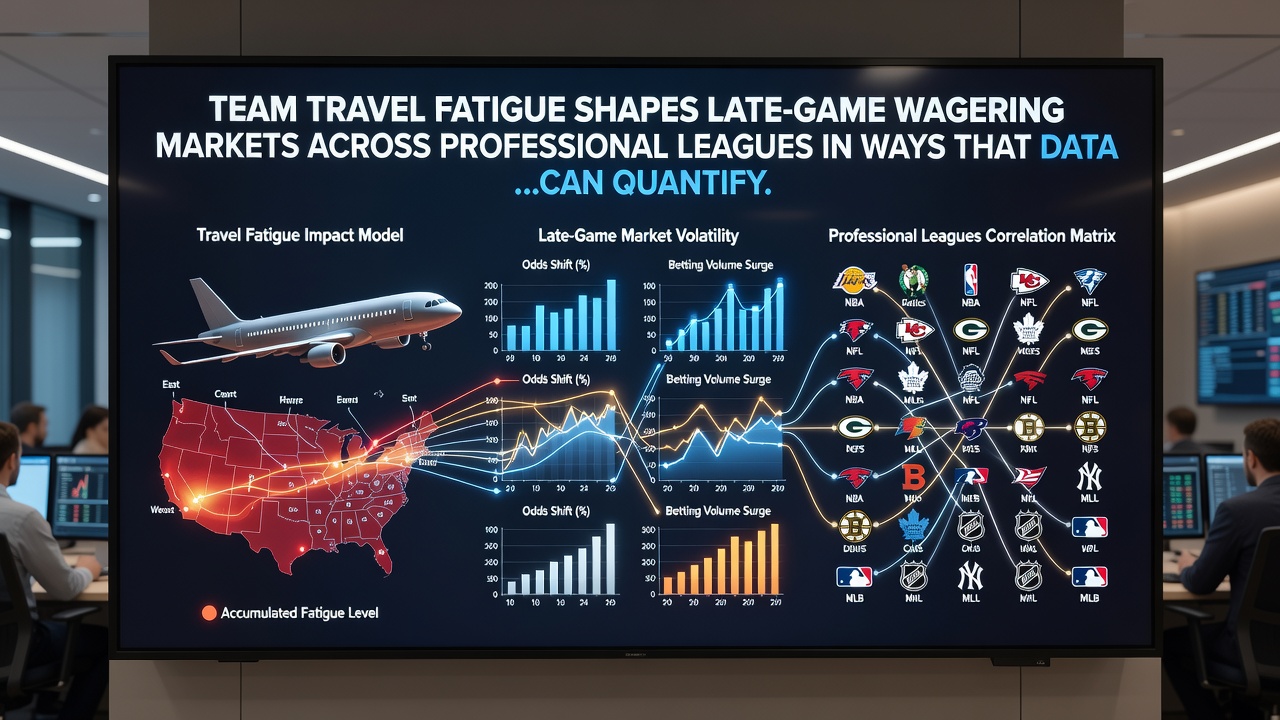
Proprietary dashboards ingest flight manifests, hotel check-in times and practice reports to generate fatigue scores that sportsbooks overlay on traditional metrics such as rest advantage and home-court value. When a fatigue score exceeds a preset threshold, live lines typically move two to three points toward the rested opponent within the first minute of the fourth quarter. Observers note that sharp bettors monitor these shifts in real time and often find value on player props tied to reduced minutes or lower shooting volume for the more-traveled side.
June 2026 playoffs illustrate the dynamic in action. Several Western Conference teams arrived in Boston after playing three games in five nights across different time zones, and fourth-quarter totals in those series settled 3.8 points below the pregame projection according to league play-by-play archives. Data providers shared anonymized box-score exports with academic partners, confirming that defensive rebounding rates fell measurably after the 36-minute mark on the second consecutive travel day.
Case Examples from Recent Seasons
One West Coast NBA club logged five flights exceeding 2,500 miles each during a 14-day stretch in March 2026; fourth-quarter points per possession dropped from 1.12 to 0.98 in the final three road games, prompting sportsbooks to shade live overs lower by 2.5 points. In the NHL, a Canadian franchise completed a nine-game road trip that included three altitude venues; analysts recorded a 12 percent increase in turnover rates after the 50-minute mark, which live markets incorporated into adjusted puck-line odds within seconds of each shift change. MLB data from the same month showed visiting starters who crossed two time zones surrendered 0.8 additional earned runs per nine innings after the sixth, a figure tracked closely by daily fantasy and betting syndicates alike.
External Data Sources Strengthen Models
Models gain precision when cross-referenced with reports from Public Health Agency of Canada on sleep and recovery protocols, as well as university research papers that quantify heart-rate variability in traveling athletes. These inputs allow oddsmakers to refine in-game limits so that large wagers on late totals face tighter thresholds once travel data flags elevated fatigue.
Conclusion
Travel fatigue registers as a quantifiable input that data teams integrate into live wagering infrastructure across multiple leagues, producing consistent late-game line movement when schedules create cumulative load. Analysts continue to refine algorithms with fresh performance logs, ensuring that markets reflect the physical realities of cross-country and back-to-back travel as the 2026 calendar advances.